The UMP Score is a tool I created to help manage, track, prioritize and follow-up on defects encountered by our customers. UMP stands for “Unified Metrics Priority” was a name that was around for a much simpler system used in the past and someone somewhere decided it was a good name. While improvements continue, right now it allows our support and engineering teams to see various defects/bugs that have been filed, the customers who are affected and a calculated score using information about the defect, case and customer.
The Problem
In any software product or project, despite everyone’s best efforts, some things don’t go well and sometimes that means there are defects or bugs. Sometimes they are a big deal and are preventing customers from using large sections or the entire project. Obviously those should be addressed very quickly. Other times, they are small annoyances that can be worked around, or that make something a bit harder or less convenient. Determining how and when to address those things can be difficult when balancing all the demands, such as new features or even other defects.
Even with a good understanding of all the defects across a product, it isn’t always simple to determine what should be addressed first. As a product manager or development team you have to understand all the use cases where a customer may encounter a particular defect, how many customers may encounter it, how does it impact the customer’s business or activity and/or how does it affect your business? You need to consider and understand the risk involved – can the fix be made “safely” without introducing new problems; how much effort will it take to address the defect; how can the fix be delivered to the customer?
And that isn’t all. Anyone who has ever worked in software worked at all knows that not every decision is made based on technical information only. There is also the customer to consider, as well as the realities of doing business. If a customer is more valuable to the team/company (aka pays more money), then that may make the issues they encounter more important or impact their priority. This introduces a whole new set of complexity – is it better to fix a defect that lots of “small” customers have run into or one that a single “huge” customer has to deal with? What about how long customers have been impacted by the problem? Does it become more or less important to fix something as time passes and customers are dealing with it?
Now just put all of that into a very large product that has been around for quite a while and used by thousands of customers throughout the world in businesses and organizations of all sizes. With many different engineering teams, product managers and product engineers all working on multiple areas of the product. Prioritizing defects and making the right decisions to best help customers becomes a formidable challenge
The Solution
The UMP Score is an attempt to help simplify and better understand the many aspects that contribute to prioritizing defects encountered by customers. There are two different parts of the tool to get to the end result. The first is how to consolidate all the information that we have into some kind of metric, value or indicator – develop a model. The second is how to make that information available to the interested parties when then need it and make sure it is accurate.
The Model
I didn’t originate the “idea” of using a score (that became named the UMP score) to help understand defects. However, the previous model was extremely simplistic and didn’t prove very useful. It was a simple formula with basic addition and multiplication, with a range of 0-100. If the result of the formula was greater than 100, it turned into 100. That turned out to not be that helpful as many would get up to or close to 100 and everything above 100 was basically the same. The original model was a linear model that used the severity of the defect, number of customers “attached” and time since the defect was filed.
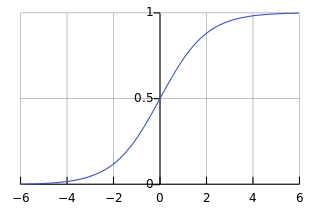
A logistic curve. By Qef (Created with gnuplot) [Public domain], via Wikimedia Commons
The formula for this provides for various inputs, such as the starting value, a growth rate and a maximum value. It increases slowly at first, rapidly in the middle then slows again as it approaches the max limit.
Sorry… there is so much to put here. I’ll get to it soon. Must do work now.
–<TODO> Finish writing this all </TODO>–